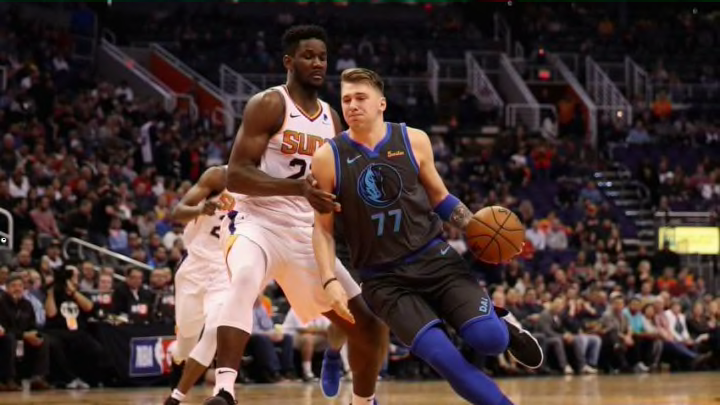
The Dallas Mavericks lost to the Phoenix Suns on Dec. 13, but it was bad luck that sank the Mavs more than anything else.
The Dallas Mavericks thought they had a sure win against the Suns on Dec. 13. Phoenix continues to free fall in the fight for the second consecutive first overall draft pick. Before the game with Dallas, the Suns lost ten consecutive contests.
They added another problem with the absence of Devin Booker. All the more surprising that Phoenix defeated the Mavericks for the second time in the season. Now 40 percent of the Suns’ victories this season are wins over Dallas.
Both defeats have objective reasons. The first happened in the opening game of the season. The second occurred on the second of a back-to-back where the Mavs had to travel from Dallas to Phoenix.
However, in addition to these reasons, there is another which is simply bad luck.
Closest defender analysis
For the analysis let us take a look at the values of the closest defender. Fans can read more about it in this article about the three-point shots against the Mavericks early this season.
First, I found the accuracy of the shots from all the possible options that this statistic provides. There are four options for the distance to the closest defender and three for the distance to the rim. I collected this data for Dallas and Phoenix shots, as well as their opponents.
I then found the average value between the same elements for the Mavericks and opponents of Phoenix and, respectively, for the Suns and opponents of Dallas.
Table %FG for @dallasmavs and @Suns and their Opp in matches against them. MeanD% considers the average value of the between to be the same elements of Dallas and Phoenix Opp, MeanP% between Phoenix and Dallas Opp.#MFFL #Suns pic.twitter.com/4AmqjGm4nC
— Vladislav Shufinskiy (@vshufinskiy) December 14, 2018
The logic here is simple. One team shots with a percentage of X. The other team allows the opponent to shoot with a percentage of Y. In a face-to-face meeting, the expected percentage of accuracy will correspond to the average between X and Y.
From a mathematical point of view, it would be more correct to take the weighted average (when the percentage depends on the number of shots), and add the NBA averages to the required number of games to stabilize, but we will omit this part.
Probability of success
Next, MeanD% and MeanP% are used as the probability of success in the binomial distribution.
Example of calculation of the binomial distribution of shots in the matches@dallasmavs vs @Suns
— Vladislav Shufinskiy (@vshufinskiy) December 14, 2018
n-number of shots
k-number of made shots
p-probability of success(MeanD% or MeanP%)
Probability-value of binomial distribution
Green highlighted the real number of accurate shots pic.twitter.com/ulMB2lbaRZ
Then I found the probability of getting the same number of made shots or less. For example, if you threw once and made, then Prob. <= will be equal to one because you can not improve this indicator. I’ve arranged the types of shots by the closest defender in ascending order of their frequency.
The following is the graph for the Mavericks.
The probability graph of @dallasmavs to throw as well or worse as they actually threw in 2 games against @Suns. The throws are divided by indicator "closest defender" in ascending order of their frequency. The red line is at 0.5(the expected value)#MFFL #DALatPHX pic.twitter.com/PW9OrwvF80
— Vladislav Shufinskiy (@vshufinskiy) December 14, 2018
Here is the Suns’ chart.
The probability graph of @Suns to throw as well or worse as they actually threw in 2 games against @dallasmavs . The throws are divided by indicator "closest defender" in ascending order of their frequency. The red line is at 0.5(the expected value)#Suns #DALatPHX pic.twitter.com/VDvqQKqah3
— Vladislav Shufinskiy (@vshufinskiy) December 14, 2018
We see the contrary picture. Dallas’ four greatest frequency shots were worse than expected (two is much worse). Phoenix three types of shots with the largest frequency left much better.
For example, Suns made 13 out of 25 3-point field goals with a distance of 6-plus feet to the closest defender. The probability that they would be able to make 14 and more is only four percent.
On the other hand, Dallas got a terrifying three out of 28 shots from beyond the 3-point line with the closest defender four to six feet away. The probability of getting two, one or never is just one percent.
Mavericks have played poorly in both games against the Suns this season, and they deserved to lose. This needs to be recognized, but it is worth noting that the fortune in these games was not on our side. Hopefully, things will turn in our favor in matches with more difficult opponents.
My calculation database.
